Questions? 1.800.239.0356

X
1.800.239.0356
Back to Top
HOT TOPIC — Pain at the Pump: Why Does It Cost More to Fill Your Tank?

HOT TOPIC — Pain at the Pump: Why Does It Cost More to Fill Your Tank?

Published: July 02, 2018

The Memorial Day weekend is the beginning of the summer driving season, and — not coincidentally — often a high point in the annual ups and downs of gas prices. This year, almost 37 million drivers hit the road and faced the highest fuel costs since 2014. The national average price for a gallon of unleaded gas was $2.97, up $0.60 from Memorial Day 2017. The price in California, the most expensive state for gasoline, averaged $3.74 per gallon.1

Prices at the pump eased off a little in June, but motorists can expect an expensive summer behind the wheel. If you’re like most consumers, you may feel that you’re playing gas-price roulette every time you fill the tank. Why are prices so volatile? And why is the trend so much higher now than last year?

Cost of Crude

The price of crude oil is the most significant factor in the cost of fuel at the pump. For the period from 2008 to 2017, the U.S. Energy Information Administration estimated that crude accounted for 61% of the national average cost of a gallon of regular gas, with the rest attributable to refining (12%), distribution and marketing (12%), and taxes (15%).2 All of these costs can vary at different times of the year and in different locations, but the cost of crude is subject to wide swings due to supply and demand on a global playing field.

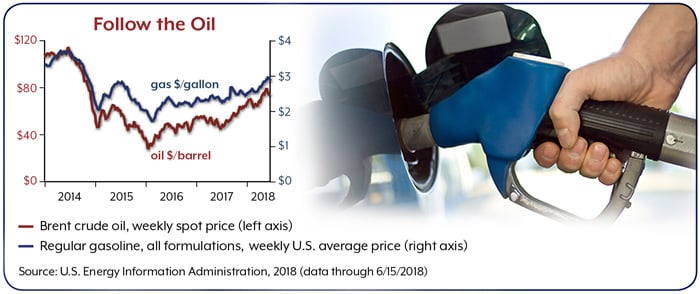
The simple explanation of why gas prices are high this summer is that oil prices have reached levels not seen since 2014. The price of Brent crude, the global benchmark, topped $80 per barrel on May 22 before sliding back to around $75 in mid-June. Back in June 2014, when the national average gas price was more than $3.50 per gallon, Brent topped out above $115 per barrel before plummeting to less than $30 in February 2016.3 The steep decline was driven by increased U.S. production, primarily from shale oil, in a global economy that was slow to recover from the recession. There was more oil than the market could handle.4

To reduce the glut and prop up prices, the Organization of the Petroleum Exporting Countries (OPEC) and non–OPEC oil exporters led by Russia agreed to cut production starting in 2017 (later extended through the end of 2018).5 With the United States continuing to produce at high levels, the OPEC strategy took time, but a strong global economy has driven demand, and oil prices have risen steadily over the last 12 months.6

Dwindling Supplies

Although oil exporters benefit from higher prices, increased costs and dwindling supplies have generated concern among industrialized oil-consuming countries, including the United States, which still depends on imports for almost 20% of the petroleum products that it consumes.7

A June 2018 report from the International Energy Agency predicted a continued increase in global demand in 2019, while noting that oil reserves among industrialized nations fell to a three-year low in April 2018. The economic crisis in Venezuela and the threat of renewed sanctions against Iran have added to concerns about oil supplies.8

At a meeting in Vienna on June 22–23, OPEC — supported by Russia and other non–OPEC oil exporters — agreed to a modest increase in production of up to 1 million barrels per day, about 1% of the global daily supply.9 The actual increase is expected to be less, but the additional output may help stabilize the market through the end of the year. Motorists could see some relief by late summer, but gas prices are likely to remain higher than last year.10

A Driving Nation

Despite high gas prices, Americans are embracing the summer driving season. For the week ending June 8, the estimated consumer gasoline demand rate was 9.88 million barrels per day, the highest weekly estimate on record.11

Still, pain at the pump may slow consumer spending on other goods and strain the consumer-driven U.S. economy. The American Automobile Association estimates that U.S. drivers are spending an average of $69 more per month on gasoline this summer compared with last summer. Even with an improved economy and a tax cut, this is a significant burden. The average American is spending about 7% of his or her annual income filling the tank.12

How much is too much? In a survey conducted earlier this year, about a third of consumers said they would change travel plans if gas prices hit $3.00 per gallon. Almost half said prices would have to reach $3.50 per gallon before they would cut back on their driving.13

Of course, the breaking point depends on your pocketbook, your transportation needs, and where you live. Gas prices vary widely on a regional basis due to distances from suppliers, local competition and operating costs, state fuel standards, and state and local taxes. Paying $3.00 per gallon might sound like a bargain to a driver in California or Hawaii, but it could be a game changer in Oklahoma or Alabama, where prices were under $2.60 in mid-June.14

No matter where you live, it might be worth doing some research and planning when buying gas. Keep in mind that quality can vary, especially at off-brand stations, and some vehicles have special fuel requirements. For gas prices in your ZIP code, check gasbuddy.com. To estimate the fuel costs of a road trip, try the AAA calculator at gasprices.aaa.com/aaa-gas-cost-calculator/.

Safe travels, no matter what you pay at the pump!

1, 10–14) American Automobile Association, 2018
2, 3, 6–7) U.S. Energy Information Administration, 2018
4) The World Bank, 2018
5) Reuters, December 10, 2016, and November 30, 2017
8) International Energy Agency, 2018
9) Reuters, June 23, 2018

This information is not intended as tax, legal, investment, or retirement advice or recommendations, and it may not be relied on for the purpose of avoiding any federal tax penalties. You are encouraged to seek advice from an independent professional advisor. The content is derived from sources believed to be accurate. Neither the information presented nor any opinion expressed constitutes a solicitation for the purchase or sale of any security. This material was written and prepared by Broadridge Advisor Solutions. © 2018 Broadridge Investor Communication Solutions, Inc.